در درون قبض برق ۲۵۰ دلاری: کالبدشکافی منفورترین نامه انتخابات میاندورهای
در درون قبض برق ۲۵۰ دلاری: کالبدشکافی منفورترین نامه انتخابات میاندورهای. امروز، شاید برای نخستین بار در تاریخ مدرن آمریکا، قبض ماهانه برق در رأیگیری مطرح است. البته نه به معنای واقعی کلمه (اگرچه در ۹ ایالت، کمسنرهای خدمات رفاهی اینگونه هستند)، اما همانطور که رویترز روز جمعه بیان کرد، این میتواند «نخستین انتخاباتی باشد که در آن شرکتهای خدماتی و برق، به طور خاص، به عنوان...
Inside The $250 Electric Bill: Dissecting The Midterms' Most Hated Piece Of Mail Today, for perhaps the first time in modern American history, the monthly electric bill is on the ballot.
Not literally, of course (although in nine states , utility commissioners literally are), but as Reuters put it on Friday, this could be " the first election to feature utilities and electricity, specifically, as a prominent issue in the midterms . " Readers who have been with us for a while will not be surprised. Back in August 2025, when the "power bill crisis" was still a story mostly confined to angry Maryland Facebook groups, we posted a chart of CPI electricity with a big arrow pointing up and a simple prediction:
In one year, this will be the most popular chart on this site pic.twitter.com/h93gWXMoNL
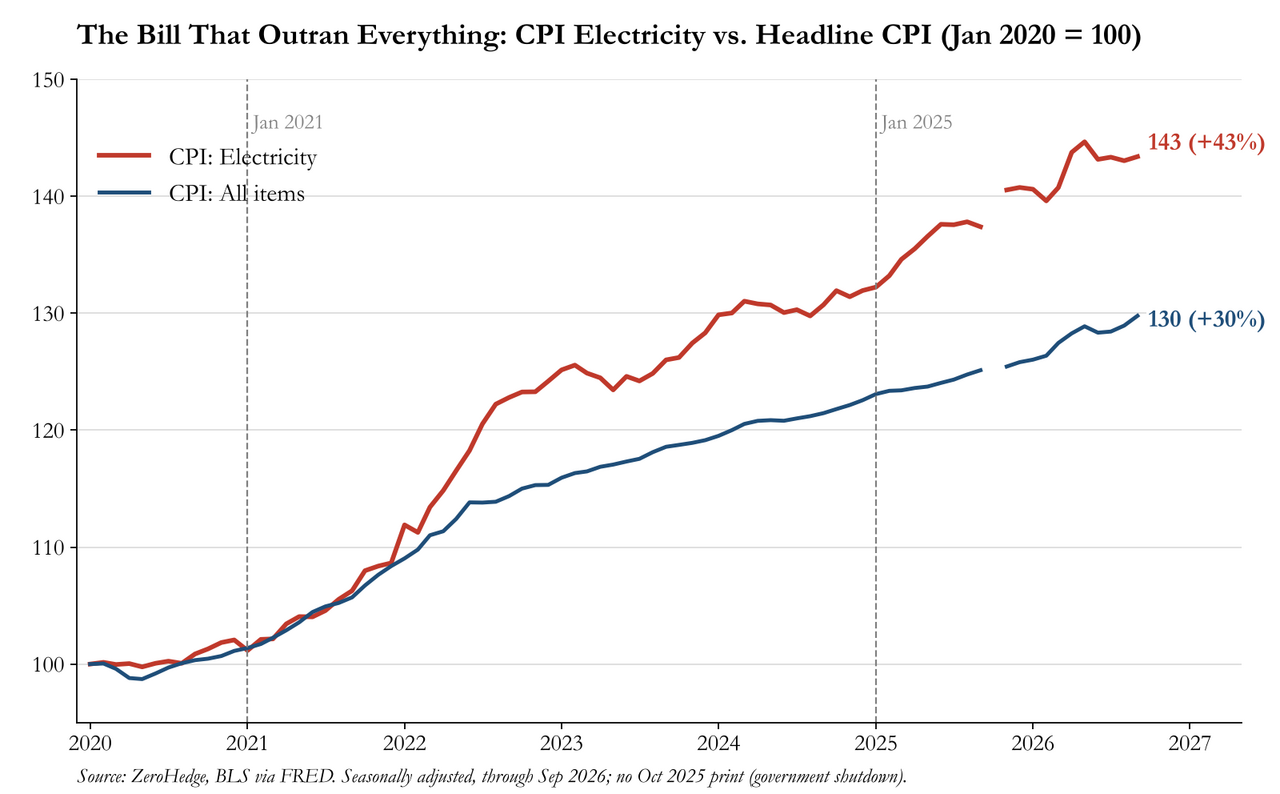
— zerohedge (@zerohedge) August 11, 2025 Fifteen months later, here is that chart updated through the latest (September) CPI report : since January 2020, the electricity component of CPI is up 43%, while the headline index is up 30% . The average price of a kilowatt-hour has gone from 13.4 cents to 19.6 cents, a 46% jump, and the electricity CPI is still rising 4.4% a year.
And before either party starts taking a victory lap: the average price per kWh rose 32% between January 2021 and January 2025, and another 9.5% since then, in a year when voters were promised that energy prices would be cut in half . Bipartisanship at its finest.
Last month we used Goldman's new "Affordability" series to map out where bills have gone up the most, and we tweeted this chart , which was seen over 200,000 times, which tells you something about how many people are staring at their own bill:
With the polls now open, we figured it's worth revisiting the same report, " Inside Customer Affordability: An Introduction to the Electric Utility Bill " ( available to pro subs ), from the other direction: open the envelope, go through the bill line by line, and figure out which line items are actually doing the damage . Because, as it turns out, the answer depends a lot more on your ZIP code than on which party you vote for.
Goldman's utilities team led by Carly Davenport starts with the basics:
"The typical electric bill consists of three primary components: supply charges, delivery charges and other customer charges. In short, this covers the cost to generate power, deliver it to the end customer, maintain the grid, and (in some cases) implement state policy goals. Supply charges are primarily driven by natural gas prices, wholesale power costs and capacity markets; delivery charges reflect transmission and distribution investments; while other charges include taxes, public benefit programs, low-income assistance, clean energy mandates and wildfire-related costs. As a result, customer bill increases can stem from commodity costs, infrastructure investment, public policy programs, or a combination of all three. "
Simple enough. But here is where it gets interesting: the mix of the three varies enormously depending on who mails you the bill. Consider the sample Con Edison bill Goldman uses (a small NYC apartment, 242 kWh in February 2024): of the $103.47 total, just $31.21 is the actual electricity. The other $72.26, or 70%, is delivery , i.e., the poles, wires and substations of the regulated utility, plus taxes and the "System Benefit Charge."
(Source: Con Edison via Goldman Sachs) Now cross the Hudson. For the two New Jersey households whose actual bills Goldman tracked for over a year (one served by FirstEnergy's (FE) JCP&L, one by PSEG's (PEG) PSE&G), the split flips: generation is about 73% of the JCP&L bill and supply about 70% of the PSE&G bill. Same metro area, mirror-image bills. Which probably explains why the political debate over "who's to blame" is so confused: in New York, the answer is mostly the utility's own spending; in New Jersey, it's mostly the wholesale market the utility doesn't control.
Nationally, generation still accounts for the lion's share, but the trend is worth noting: per EIA data, generation's share of the average price has slipped from 62% in 2015 to 56% in 2025, while distribution rose from 27% to 30% and transmission from 11% to 14% . In other words, the grid itself (and the return utilities earn on building it) is eating a growing piece of every bill, a point we'll come back to.
If you've ever tried to read your bill and gave up halfway, that is probably because of the riders. Goldman defines these as "specialized, state-approved billing mechanisms that bypass traditional rate cases to allow utilities to recover specific costs": fuel and storm cost deferrals, public benefit and wildfire charges, bad-debt recovery (which, helpfully, "tend[s] to rise during periods of high inflation or economic stress", so customers who pay end up covering those who can't), and capex riders such as the DSIC, which lets a utility recover grid spending "between formal base rate cases."
Translation: a lot of what you pay never goes through the public rate-case process that makes headlines. It just shows up.
The best illustration in the report is a sample residential bill from American Electric Power's (AEP) Ohio utility. It's long, so we broke it down:
Of the $252.98 total, $121.03 (48%) is generation, which the bill helpfully notes Ohio Power "makes no profit from." The "Electric Grid Base Rates" (the part set in a rate case, i.e., the part politicians yell about) come to just $56.79, or 22%. And then there are ten more line items: a transmission rider, a state kWh tax, a tax-savings credit, energy efficiency, PIPP (funding Ohio's low-income bill payment program), a reliability rider for tree trimming, a distribution investment rider, an economic development rider, a storm rider and a gridSMART rider for the smart meter. Add up the riders alone and they come to $71.72, more than the base rates themselves. Here is the original:
The Northeast sample bill (Eversource (ES)) tells a similar story with different labels: on top of supply ($96.12), transmission ($28.67) and local delivery ($59.09), the customer pays $12.69 in "Public Benefits," including a federally mandated congestion charge (FMCC) for the privilege of living somewhere transmission lines can't carry enough cheap power. That's about 6.5% of the bill for policy goals the customer may or may not support, and which public power customers often don't pay at all (more on that below).
Still, if there's one charge that explains why the power bill went from a niche gripe to a national campaign issue, it's the one buried inside "supply" in PJM, America's biggest grid: capacity.
Capacity is what PJM pays power plants to promise to be available when needed, and those payments flow straight into the supply charge. When supply tightens (plant retirements) and expected demand surges (data centers), the price explodes. Which is exactly what happened: the capacity price went from $28.92/MW-day to $269.92/MW-day , an ~833% jump, before hitting the price cap of $329.17 the following year, and, well, it has stayed pinned at the cap ever since:
Goldman's tracked PSE&G customer shows exactly what that looks like on an actual bill: supply cost per kWh jumped 25% year-over-year in May 2026 (the month when the 833% comparison hit), and another 10% in June, when the next step-up kicked in. Delivery charges, the part the utility actually earns on, fell in every single month shown.
Zoom out further and Goldman finds a 73% R-squared between JCP&L's annual average bill and PJM capacity prices; add natural gas (TETCO M3) and a multi-variable regression explains 88% of the move over six years. Put differently, in New Jersey the bill is mostly a function of two numbers no governor directly controls.
And who drove those two numbers? According to PJM's own independent market monitor, data centers were responsible for $29.4 billion, or 46%, of the $63.6 billion in capacity charges across the last four auctions, and per the same market monitor ( via Bloomberg ), will add at least $23 billion to customer bills in the three years ending May 2028. And that's with a price cap: as we showed last December, without price controls, electricity bills would explode .
One small piece of good news: as Wolfe's Steve Fleishman notes in his latest Power Trip note, this year's New Jersey BGS auction resulted in "only negligible summer bill changes" (PSEG bills down $3/month, ACE flat, JCP&L up $2) after last year's auction "showed electric bills jumping 17-20% in June when PJM capacity auction results took effect – this drove heightened political sensitivity." That's what happens when capacity is capped: bills stop going up. They just never come back down.
Which brings us to the slower-moving, and arguably more durable, driver of the bill: utility capex.
Goldman lays out how a regulated utility makes money with the following formula, and it's worth staring at for a moment:
Regulators set the return (the WACC) a utility can earn on its rate base, i.e., everything it has built minus depreciation, plus new capex. As Goldman puts it, " That allowed revenue increase will ultimately be reflected in customers' electricity bills. " Since the return is earned on capital deployed, the more a utility builds, the more it earns. No conspiracy required: that is simply how the model works (and why utility stocks are valued on rate base growth).
The results show up in the data. A Bloomberg analysis of EIA data published last month found that prices at investor-owned utilities, which serve two-thirds of US households, rose 34% since 2020, compared with 19% at publicly owned utilities . "The misaligned incentives associated with an investor-owned utility make these other cost drivers worse — it exacerbates them," RMI's Gennelle Wilson told Bloomberg. The case study: a Worcester, MA retiree paying National Grid 34 cents per kWh, while her neighbor across the lake pays the municipal utility under 16 cents.
And the machine is just getting started. Per Reuters, utilities are on track to match last year's record $31 billion in rate increase requests, and S&P's RRA sees investor-owned utilities spending nearly $1.3 trillion in capex over the next five years. Goldman's own math shows what that means: in its base case, the average annual residential bill rises from about $1,900 in 2026 to roughly $2,150 by 2030; under its "bull capex" scenario (bullish for the utilities, that is), it climbs to about $2,600, with annual bill growth of 7.9% through 2029 instead of 3.7% .
To be fair to the utilities, much of that spending is needed: the grid is old, storms keep getting more expensive (JCP&L alone is seeking $476 million in storm-cost recovery on top of a $253 million distribution increase, per BofA's rate case tracker ), and someone has to connect all those data centers. Then again, "someone has to pay for it" is precisely the question on today's ballot.
Here is where Goldman throws a little cold water on the narrative. Despite all of the above, residential electricity costs are about 2.7% of disposable income, and Goldman expects that to dip to ~2.6% by 2030 as income growth outpaces bill growth. And there's barely any correlation between how fast bills have risen and how much of the wallet they take:
DC, the state with the biggest three-year increase (+55.8%), has one of the lowest burdens at about 1.8% of disposable income, while Alabama, Mississippi, Hawaii and West Virginia carry some of the highest burdens despite below-average (or even negative) inflation. Which is why Goldman concludes that "inflation is the main metric that matters for customer perception of affordability pressures." In other words, voters benchmark the bill against last year's bill, and their paycheck barely enters into it.
Maybe that's also why it feels worse than the averages suggest. Bills are lumpy and seasonal: Goldman's PSE&G customer went from roughly $100 in the winter to over $450 in July. Or, as one Pennsylvania retiree who logs her daily kWh usage in a composition notebook told Bloomberg, "They continually go up in small increments, almost unnoticeable, until one day you get that shocker of a bill and say, 'Whoa, how did this happen?'"
For lower-income households, though, the squeeze is very real. Goldman calculates that the average monthly bill takes 12.6 hours of work at the state minimum wage, roughly 30% of a 40-hour week. In Texas, it's 22.5 hours; in Colorado, 6.4.
So what does it all add up to? Goldman's base case is a gentle glide path: bill inflation of 5.9% in 2026, easing to 2.1% by 2029, a 3.7% CAGR that eventually falls back in line with PCE.
Meanwhile, Goldman's own desk thinks the political debate has already moved on. In its midterms playbook ( available to pro subs ), the bank's baskets team writes that power inflation "may be one of the more underappreciated election-sensitive themes in US equities," and that "the debate is increasingly moving away from whether datacentres should be built and towards who will pay for the incremental power generation and transmission required by datacentres." Which is also the thread running through BofA's state-by-state look at the governor races, which we discussed earlier in " These Are The States Where Tuesday's Midterms Can Pull The Plug On Data Centers."
The utilities are already feeling it. Just a few hours ago, Goldman's Davenport reiterated her Sell on Exelon, citing "more limited upside to earnings growth given affordability and regulatory risks across its PJM service territories." Per Reuters, Fitch cut its outlook for the North American utility sector to "deteriorating" back in June, citing political pressure to limit bills and profits. And as PowerLines' Charles Hua told Reuters, "the real meat will come after the election."
We agree, and we suspect Goldman's glide path is the optimistic case. It requires PJM's price cap to keep holding, capex to land in the base case rather than the bull case even as utilities file record rate requests, and data centers to stop adding to capacity costs at the same time as GE Vernova's 116 GW gas turbine backlog means new supply won't show up for years. Any one of those slipping means the "moderation" gets pushed out, again.
Which is why we keep coming back to the same answer we gave last Christmas Eve, long before Goldman came around to the same view : if the next gigawatt is for a data center, the data center should build it.
Make "behind the meter" mandatory https://t.co/ZEcmX5Ge0e pic.twitter.com/bCBnwx2E5g
— zerohedge (@zerohedge) December 24, 2025 Otherwise, whoever wins today will inherit the same bill, with a few more riders on it.
Much more in the full Goldman " Inside Customer Affordability " report, available to pro subs .
منبع: ZeroHedge — متن کامل از فید رسمی منبع، با ترجمهی ماشینی عنوان و خلاصه